Filtered Lesson Plans
Filter Lesson Plans
Lesson Plans
Showing 9 of 21 lesson plans

Is It Linear? Spotting Linear Functions from Tables
Based on: Linear and nonlinear functions (example 1) | 8th grade | Khan Academy
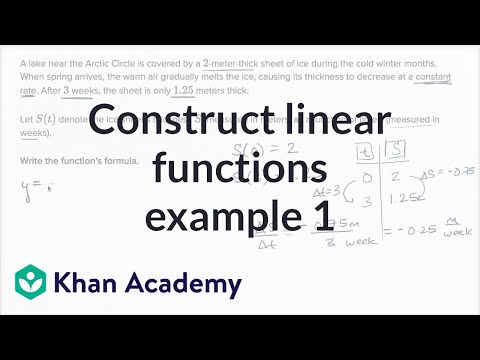
Melting Ice: Constructing Linear Functions from Real-World Data
Based on: Constructing linear functions example 1 | Algebra I | Khan Academy

Functions from Equations: Unlocking the Formula
Based on: How to create a function from an equation (example) | Functions | Algebra I | Khan Academy
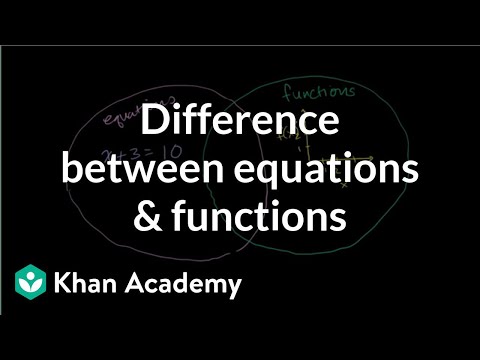
Equations vs. Functions: What's the Difference?
Based on: Difference between equations and functions | Functions and their graphs | Algebra II | Khan Academy

Decoding Proportionality: Interpreting Graphs
Based on: Interpreting graphs of proportional relationships | 7th grade | Khan Academy
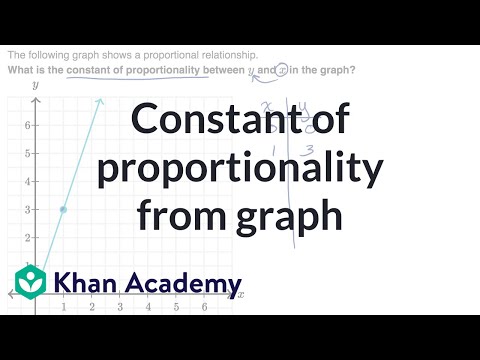
Decoding Proportionality: Unveiling the Constant from Graphs
Based on: Constant of proportionality from graph | 7th grade | Khan Academy

Comparing Rates: Equations vs. Graphs
Based on: Comparing rates | Linear equations and functions | 8th grade | Khan Academy

Graphing Proportional Relationships: Decoding the Line
Based on: Graphing proportional relationships example 3 | 8th grade | Khan Academy

Decoding Proportionality: Unveiling the Constant
Based on: Interpret proportionality constants