Fraction Line Plot Fun: Growing Up in Fourth Grade!
Lesson Description
Video Resource
Line Plots with Fractions Song | 4th Grade & 5th Grade
Math Songs by NUMBEROCK
Key Concepts
- Line plots
- Fractions (1/2, 1/4, 1/8)
- Equivalent Fractions
- Data analysis
- Common Denominator
Learning Objectives
- Students will be able to create a line plot to display measurement data with fractions.
- Students will be able to read and interpret data presented on a line plot.
- Students will be able to find a common denominator and create equivalent fractions.
- Students will be able to solve simple problems using data from a line plot.
Educator Instructions
- Introduction (5 mins)
Begin by asking students what they know about line plots. Have they seen them before? What kind of information can they show? Briefly discuss fractions and finding common denominators. - Watch the Video (5 mins)
Show the "Line Plots with Fractions Song | 4th Grade & 5th Grade" video by NUMBEROCK. Encourage students to pay attention to how the line plots are created and how the data is analyzed. - Discuss the Video (10 mins)
After watching the video, discuss the key concepts. What did they learn about line plots? How did they use fractions? Why is it important to find a common denominator? Go over any vocabulary that they might not understand. Why did the video use quarter inches instead of half inches? - Interactive Activity: Measuring Heights (20 mins)
Divide the class into small groups. Have each group measure the height of each student to the nearest quarter inch. Then, each group creates a line plot representing the heights of students in their group. Encourage them to use proper labels and titles. - Group Presentations (10 mins)
Have each group present their line plot and explain what the data shows. Ask questions like: What is the most common height in your group? What is the tallest height? What is the shortest height? What is the difference between the tallest and shortest? - Wrap-up and Assessment (10 mins)
Review the key concepts and answer any remaining questions. Administer the multiple-choice and fill-in-the-blank quizzes to assess student understanding.
Interactive Exercises
- Fraction Line Plot Race
Create a worksheet with a data set of measurements in fractions (e.g., lengths of pencils in quarter inches). Divide the class into teams and have them race to create a line plot of the data. The first team to accurately complete the line plot wins. - Real-World Data Collection
Have students collect data on a topic of their choice (e.g., the number of pets owned by classmates, the number of siblings each student has). Then, they create a line plot to display the data and present their findings to the class.
Discussion Questions
- What are some other types of data that could be displayed on a line plot?
- Why is it important to label the axes and title the line plot?
- How can line plots help us compare different sets of data?
- Why do we need to find a common denominator when working with fractions on a line plot?
Skills Developed
- Data collection
- Data representation
- Data analysis
- Fraction manipulation
- Critical thinking
Multiple Choice Questions
Question 1:
What is a line plot used for?
Correct Answer: To show data on a number line
Question 2:
What fractions did the video use to measure growth?
Correct Answer: Quarter Inches
Question 3:
Why is it important to label a line plot?
Correct Answer: To show what the data represents
Question 4:
Which of these fractions is equivalent to 1/2?
Correct Answer: 2/4
Question 5:
What do the 'X's on a line plot usually represent?
Correct Answer: Data Points
Question 6:
In the video, what unit of measurement was used to track student growth?
Correct Answer: Inches
Question 7:
What is the first step in making a line plot with fractions?
Correct Answer: Find a common denominator
Question 8:
If a student grew 1 1/4 inches, where would you put an 'X' on the line plot?
Correct Answer: Between 1 and 1 1/2
Question 9:
What does it mean to find a 'common denominator'?
Correct Answer: To make fractions have the same bottom number
Question 10:
If most of the 'X's on a line plot are above 2 1/2 inches, what does that tell you?
Correct Answer: That most people are taller than 2 1/2 inches
Fill in the Blank Questions
Question 1:
A ______ plot helps us show data on a number line.
Correct Answer: line
Question 2:
The video used ______ inches to measure growth.
Correct Answer: quarter
Question 3:
We need to find a _______ denominator to compare fractions.
Correct Answer: common
Question 4:
Fractions that are the same amount are called _______ fractions.
Correct Answer: equivalent
Question 5:
Each 'X' on a line plot represents a _______.
Correct Answer: data point
Question 6:
The bottom number of a fraction is called the _______.
Correct Answer: denominator
Question 7:
On a line plot, we always put a ________ at the top to tell us what the graph is about.
Correct Answer: title
Question 8:
1/4 and 2/8 are _______ fractions.
Correct Answer: equivalent
Question 9:
A line plot helps you organize and _________ data.
Correct Answer: analyze
Question 10:
The top number of a fraction is called the _________.
Correct Answer: numerator
Educational Standards
Teaching Materials
Download ready-to-use materials for this lesson:
User Actions
Related Lesson Plans
-
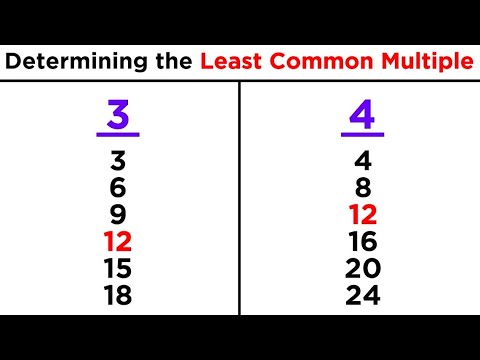 Unlocking the Magic of Least Common Multiple (LCM)4th Grade · Mathematics
 -
 Finding the Biggest Buddies: Understanding Greatest Common Factor (GCF)4th Grade · Mathematics
 -
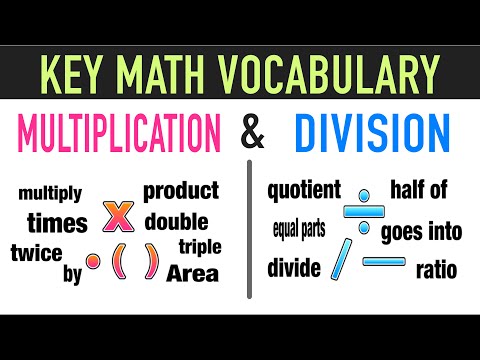 Multiply and Divide Like a Math Magician!4th Grade · Mathematics
 -
 Cupcakes and Calculations: Mastering Long Multiplication!4th Grade · Mathematics